Pandemic Lessons Learned
Preserving the insights I acquired during the COVID-19 pandemic

You probably have come to expect climate-related posts from me; this will be the rare exception. We have all just lived through a pandemic and I want to preserve & share what I learned.
In the USA about 1.3% of us die each year from all causes. But it is not constant year-round: it peaks every winter during flu season. When COVID-19 first emerged in the USA it was alarming to see the near-doubling of all-cause mortality:
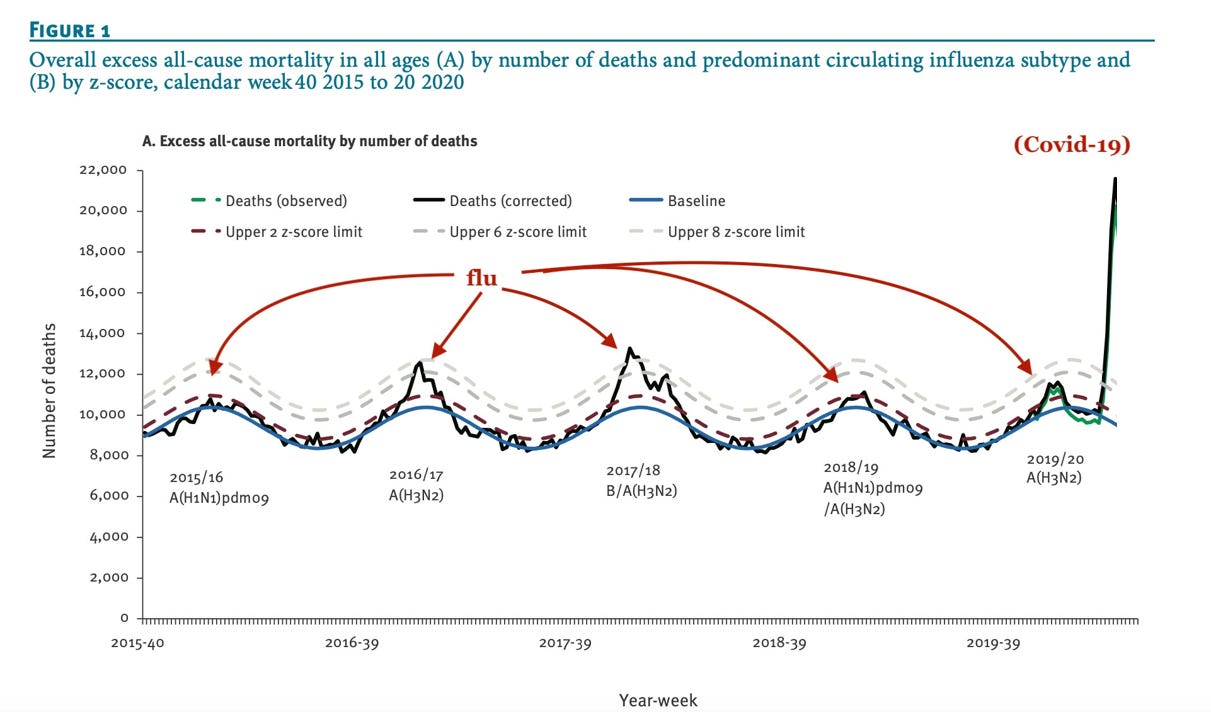
This peak in death rate occurred long before COVID-19 had spread nationwide, so my impression was: this seems bad. My family took precautions and we made it to the vaccine roll-out without contracting COVID, but my neighbor ignored the warnings and made no freedom-infringing lifestyle changes. I watched from my window on the terrible evening when an ambulance took him to the hospital because he couldn’t breathe.
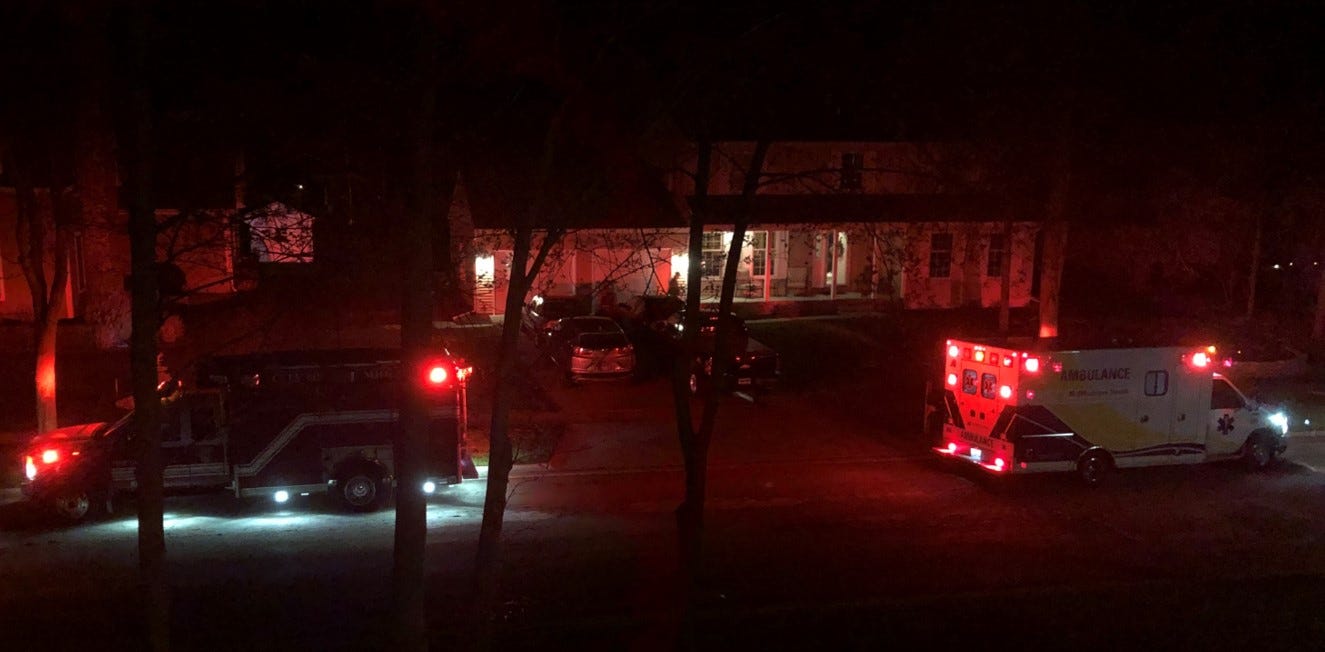
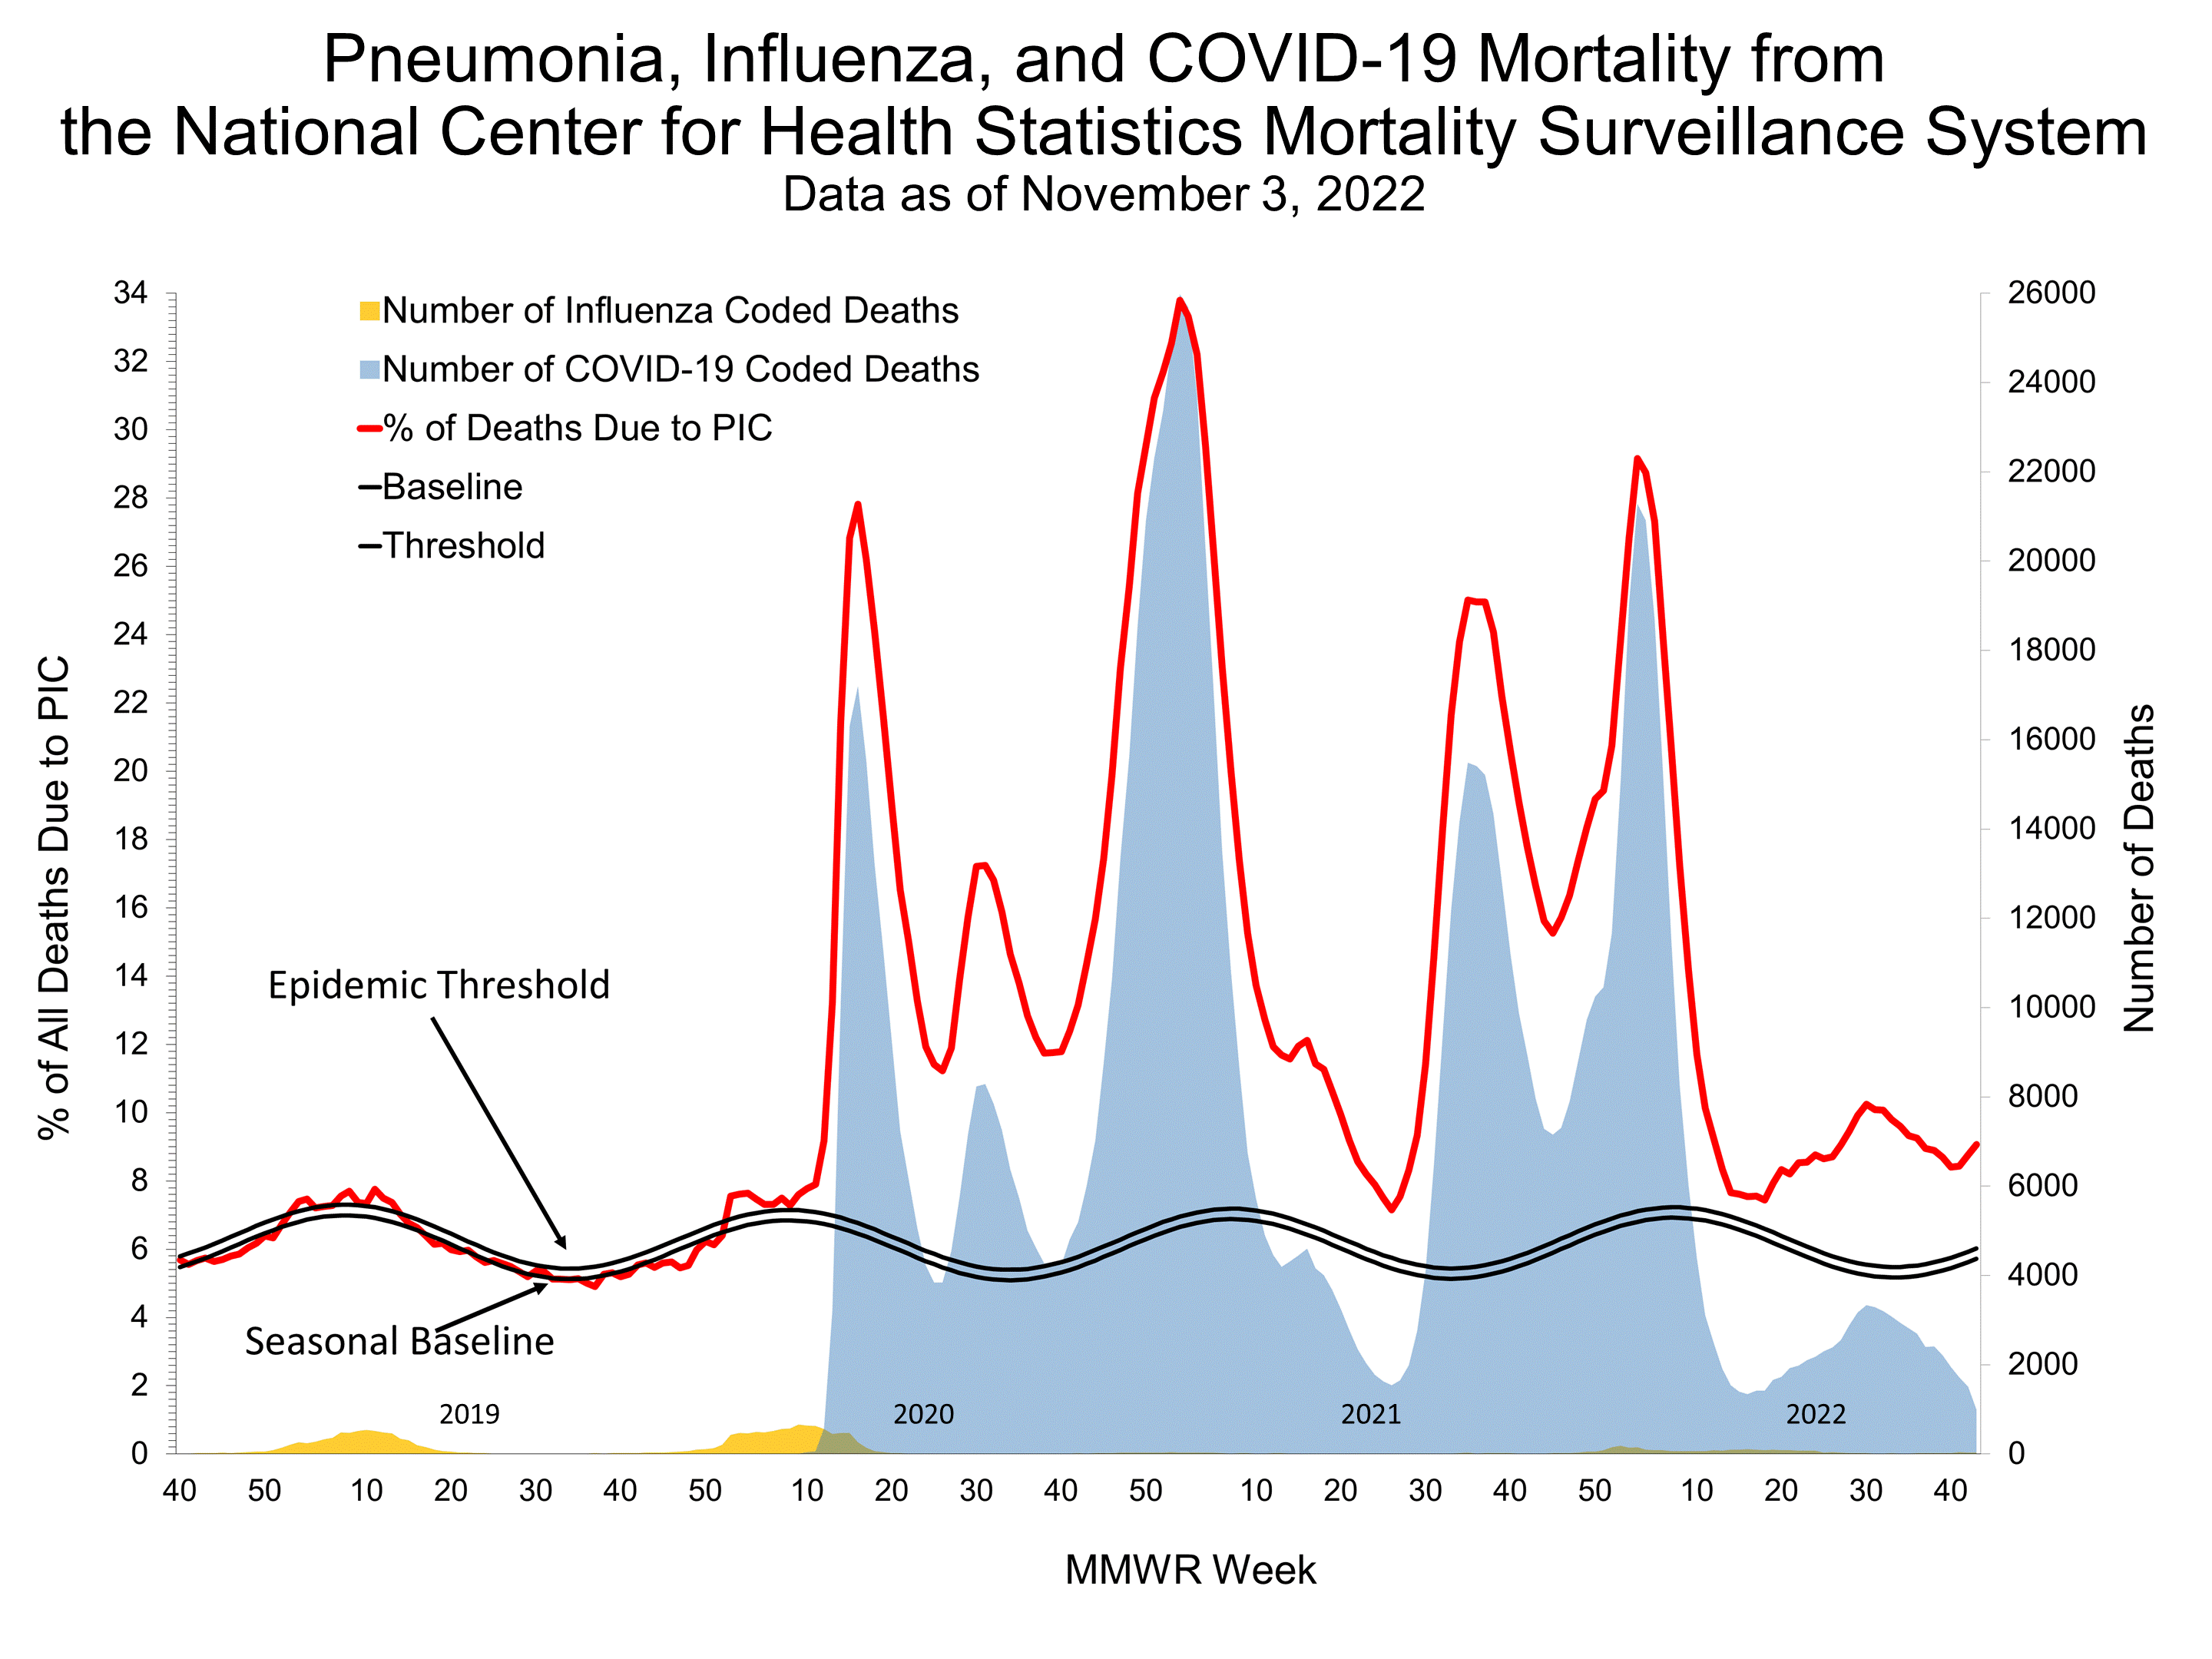
Figure 1 is no longer on the CDC website, but they have this PIC chart now (figure 2). In my judgement, the pandemic is essentially over and my lifestyle has returned to pre-pandemic mode.
During and after the COVID-19 pandemic, I spent a considerable amount of time reading two statistics books, The Premonition, The TOGETHER trial on Ivermectin, reverse-engineering the BioNTech vaccine, manufacture of the vaccine, and I followed the analyses offered by Taleb, Bevand, and Meyerowitz-Katz.
The following is what I want to remember for the next pandemic.
1. Early days
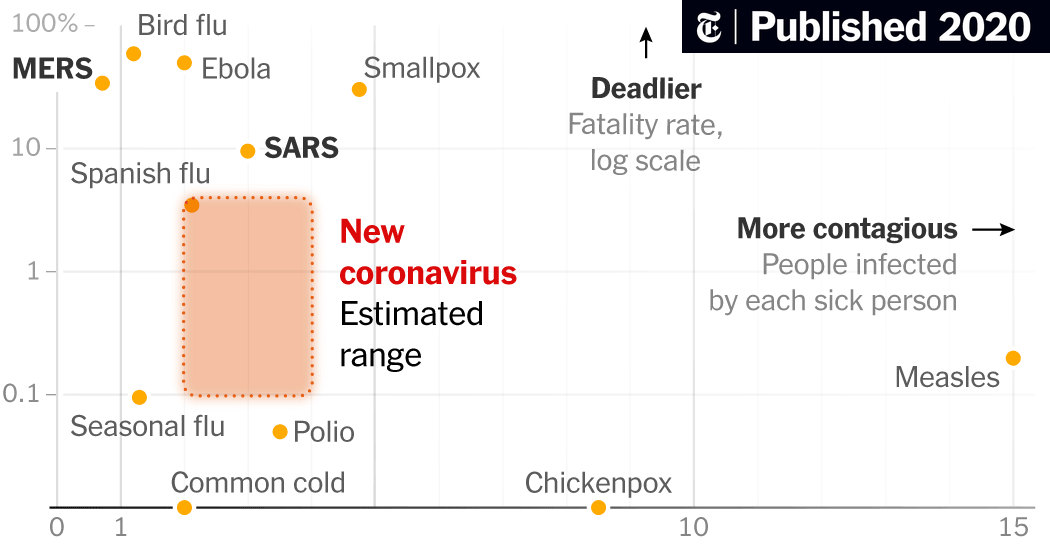
When a new pathogen first emerges, there is a lack of information about its threat level. While individuals are most concerned about the Case Fatality Rate (CFR) —because they don't want to die—at a higher level the government and hospitals worry about a large R₀ (Reproduction number) because it leads to huge numbers of infected people needing care all at once. It is generally true that deadlier viruses are less-transmissible, and less-deadly ones are more transmissible. We should be fearful of viruses that are both at the same time.
A high R₀ can quickly overload a nation's healthcare system resulting in the newly-infected receiving a downgraded form of medical care, which can then increase the CFR. This is perhaps the most under-appreciated concept by those who advocate for personal choice/100% freedom/no restrictions. Once a local healthcare system is overwhelmed (beds are full, half the doctors and nurses are sick, no more ventilators, etc) what should have been a low death rate virus becomes a much higher death rate virus. It may also be more difficult for the public to see the need to voluntarily adopt restrictions that slow the virus's spread if the CFR is low.
In the early days of an outbreak there will be virtually no test kits available, which means it is impossible to track the pathogen's movement in near-real time. Deaths reported in a community allow one to "look in the rearview mirror" and know about how many people were infected about a month ago.
Estimating deadliness/transmissibility:
Initially, the CFR will be unknown, but we will really want to know what it is. It may be possible to do some back-of-the-napkin or "redneck epidemiology” [sic] as demonstrated by Carter Mecham, retold by Michael Lewis in the book The Premonition pg. 173-174:
At midnight on January 26, the Chinese authorities announced 2,700 new cases and 80 new deaths. "I thought back to 2009 H1N1," wrote Carter at six the next morning, "and remembered how we used the 1918 Pandemic as the model in our heads (the movie) and a lesson I learned would be to be careful the next time to not cling to a single model (movie in my head) but use a range. I almost fell into the same trap this time by focusing on SARS. I did pull the 2009 H1N1 data but didn't look at that data as closely as I should have. I finally did last night." What he saw in that data was that, while the number of deaths looked a lot like the number in the early stage of the SARS outbreak, the speed at which the disease moved did not. It was moving much, much faster, and very much like the swine flu had moved. "The movie isn't SARS. And the case ascertainment isn't SARS- it is more like H1N1." It was as if he'd taken the virus to a clothing store and tried trousers on it until he found the best fit. H1N1 fit this new virus in the speed at which it was traveling. There was good news and bad news here. The good news was that it meant that a lot more people were surviving the virus than anyone knew. The bad news was that the virus would infect, and kill, vastly more people than the original SARS. Carter found a study that the CDC had made, after the fact, of the cases of swine flu that had gone undetected, or at least unrecorded, back in 2009. The numbers were incredible. For every case that had been recorded, somewhere between eighteen and forty cases had been missed.
He then asked: What if right now health authorities around the world were detecting only between one in eighteen and one in forty cases? "Yesterday we had 2700 cases and 80 deaths," wrote Carter. "Let's assume the real number of cases is 18-40 times greater, or 48,600-108,000." The 80 deaths were the result of some lower number of infections that had occurred roughly two weeks earlier; to figure out the fatality rate of the virus, you needed to know how many cases there had been. Carter did some rough math, using a reproductive rate of 2, on the low side, and 3, on the high side that is, each week, the number of cases was either doubling or tripling. "The case count 2 weeks ago would be 1/4 or 1/9 of 48,600-108,000 or 5,400-27,000," he wrote, and was likely doing the math in his head as he did. "So 80 deaths with a denominator of 5,400-27,000 projected cases 2 weeks ago, gives us a case fatality rate of 0.3%-1.5%. But these are very crude estimates."
To me, it is impressive that just a few weeks into the pandemic, Carter was able to accurately estimate the infection fatality ratio range based on a few news clips. The actual all-age IFR determined later that year was 0.68% (0.53–0.82%). Impressive!
2. Variant Progression
COVID-19 emerged as the "alpha" variant, then mutated a year later and a less-lethal, more-virulent mutant "delta" emerged. The lower CFR and higher R₀ also imparts immunity (after infection) to the alpha variant, so it took over. A year after that, Omicron emerged with an even lower CFR and a higher R0. While alpha started at 20-50x deadlier than the seasonal flu, the subsequent variants each had 25-50% of the original's CFR. Combined with the fact that an increasing proportion of the population had a prior infection, the pandemic would wind down after 2 yrs.
Not everyone does a good job updating their concern level of the virus as the subsequent variants lose their potency. Some people reach the end of the pandemic and still have the same fear level as the beginning. This usually isn’t justifiable.
The Spanish Flu pandemic of 1919 killed 2% of infected people, but the virus that did the damage—H1N1—still circulates today. We have enough herd immunity that it no longer causes a pandemic. While some will advocate for letting the virus run completely unhindered through society to quickly achieve this desired herd immunity, in fact this must be done in a gradual fashion so as not to run out of hospital beds along the way. Once a hospital is saturated, they switch into "field clinic" mode of care: people are on gurneys in the hallway, doctors spend less time with each patient, equipment is rationed, and death rates are about 2x higher than they would have been under normal care conditions.
3. Case Ascertainment Rate
For each new case identified via PCR or rapid test, some larger number of actual cases exist because not every infected individual seeks testing or care; many just "stay home sick" until recovered. The case ascertainment rate (CAR) is expected to be low in the early days of a pandemic, unless extraordinary efforts are made. For COVID-19, South Korea undertook the efforts needed to procure tests and aggressively trace the infections in the early days of the pandemic, as described in this 1-min video:
We can also tell South Korea was aggressively testing by looking at the case fatality rate (CFR) data:
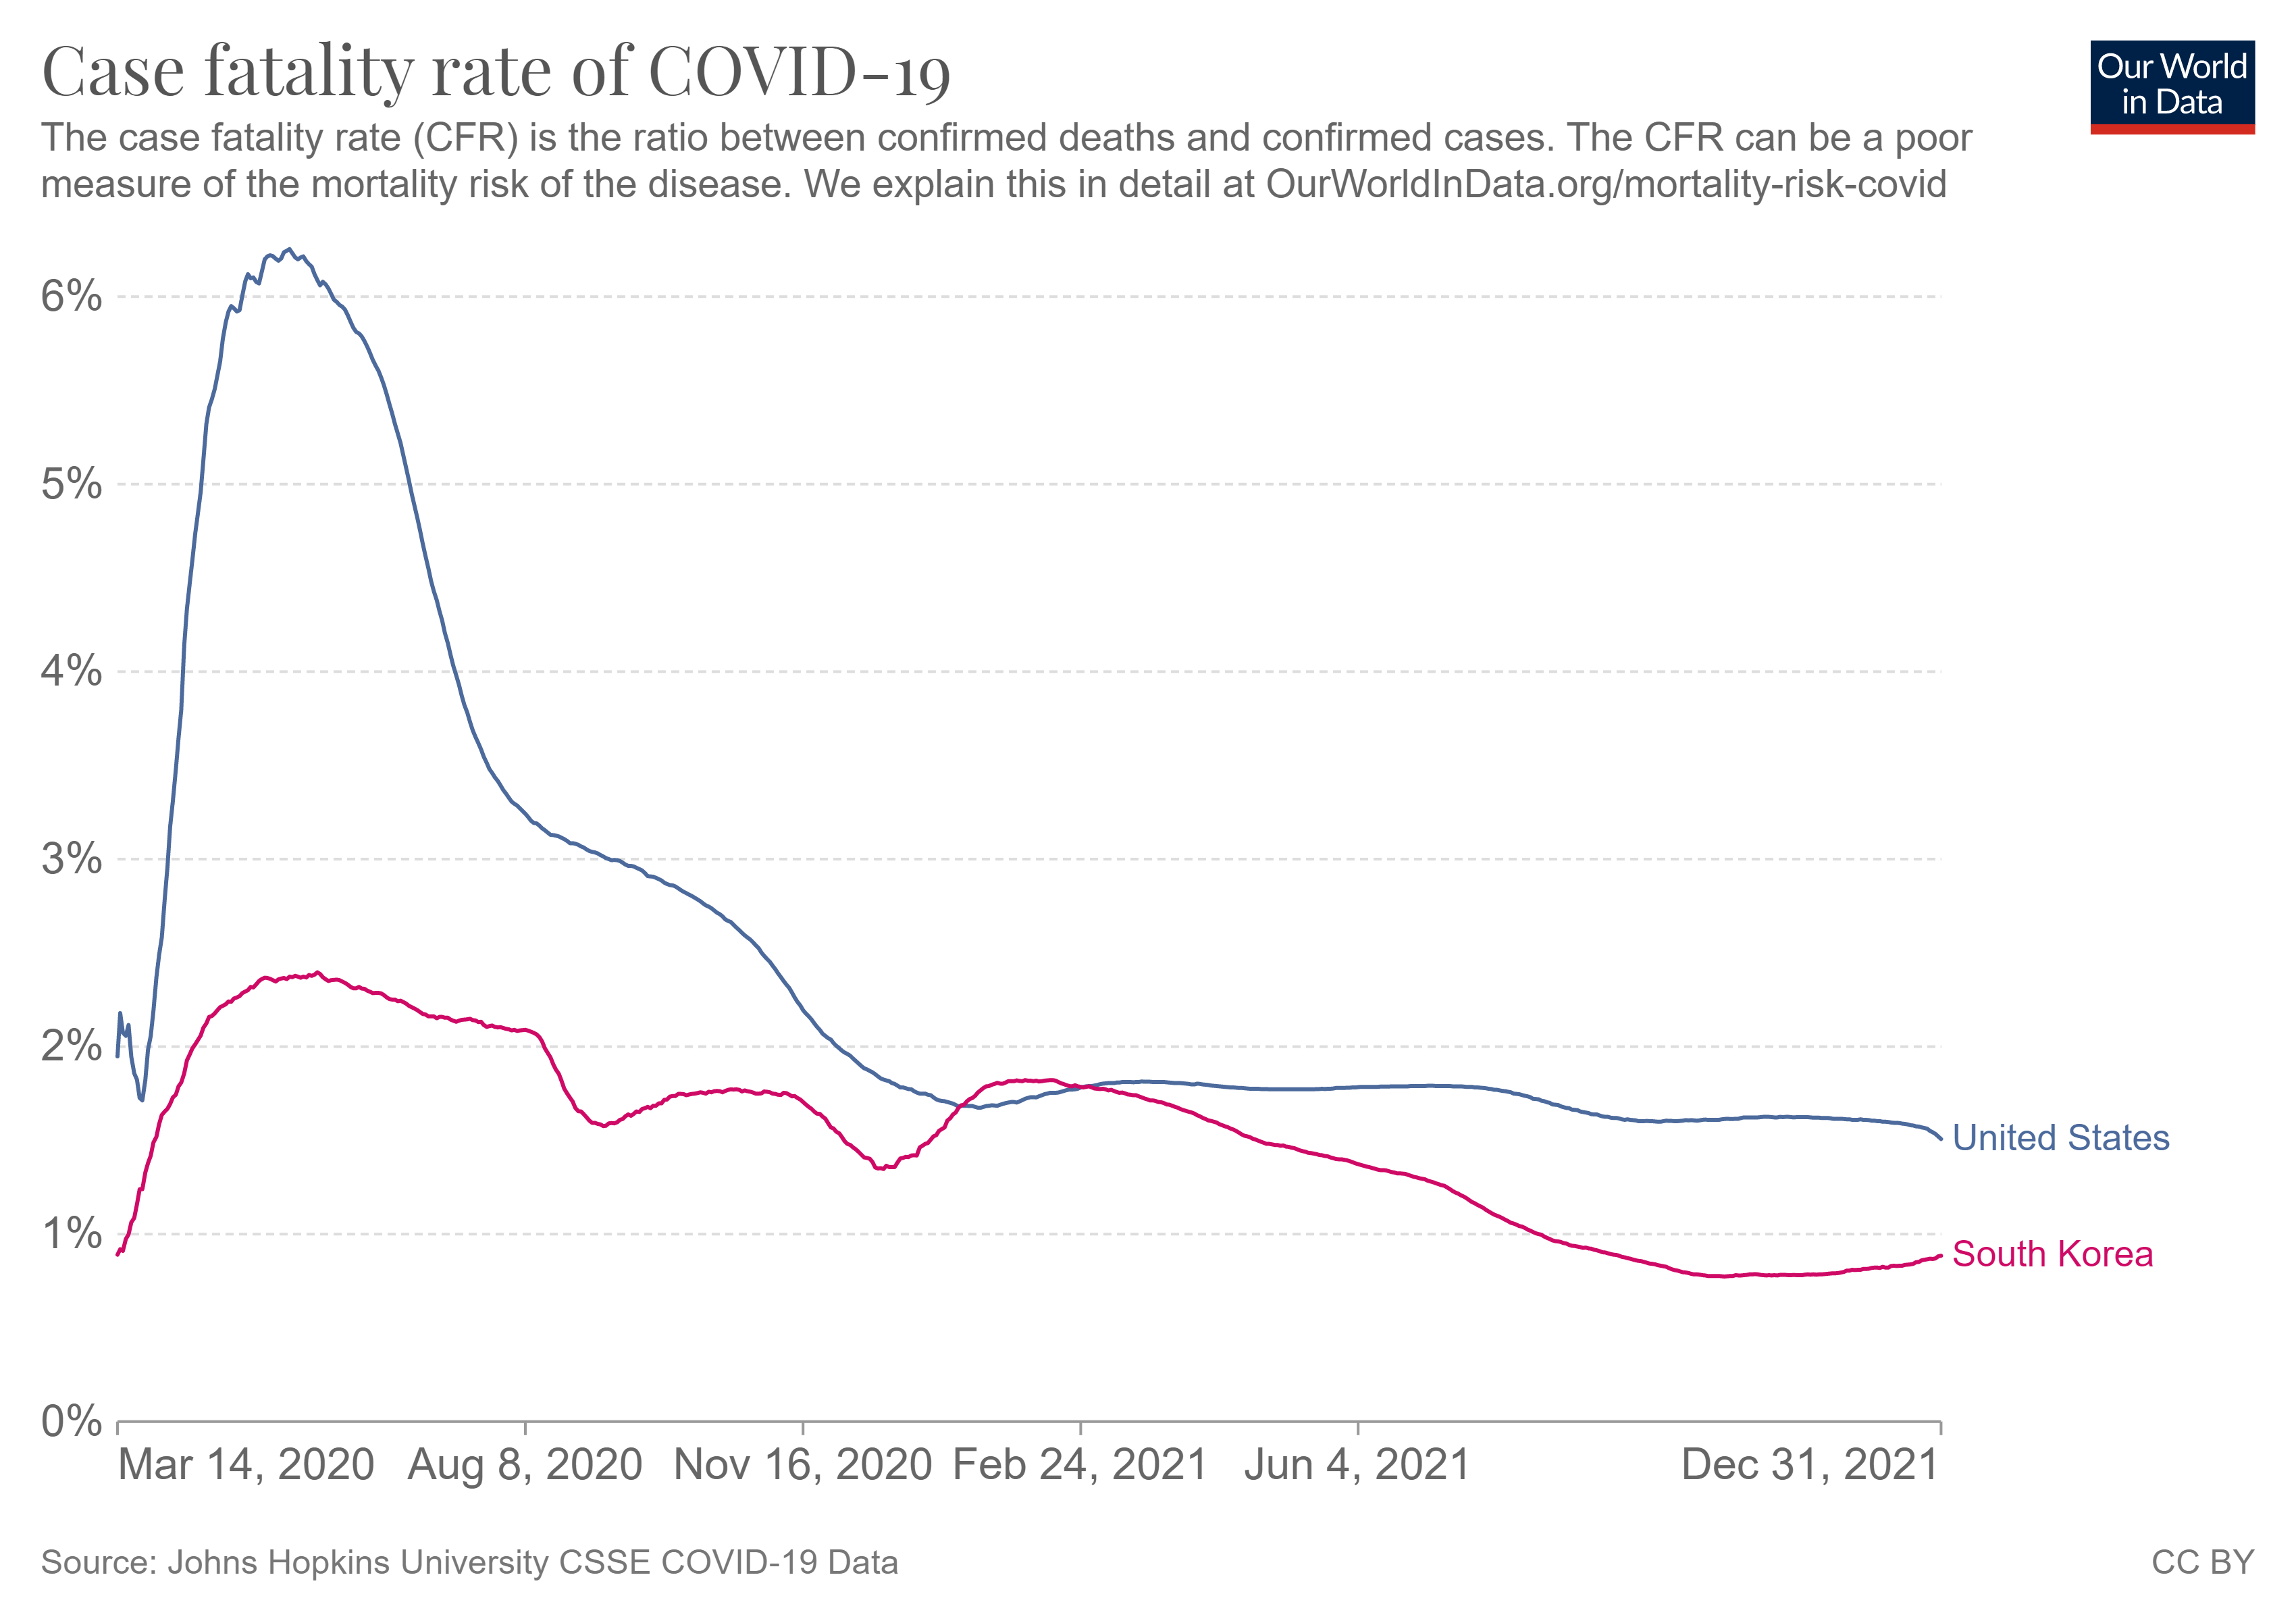
CFR is total deaths divided by total confirmed cases. But, if a nation is undertesting there will be disproportionally more deaths-per-case. Comparing the USA to South Korea, we see that South Korea has a fairly constant CFR while the USA shows a 3x higher CFR in the early months. This is not because the variant in the USA was 3x deadlier (early on we all fought the same variant) it is because the USA was doing 3x less testing, per capita.
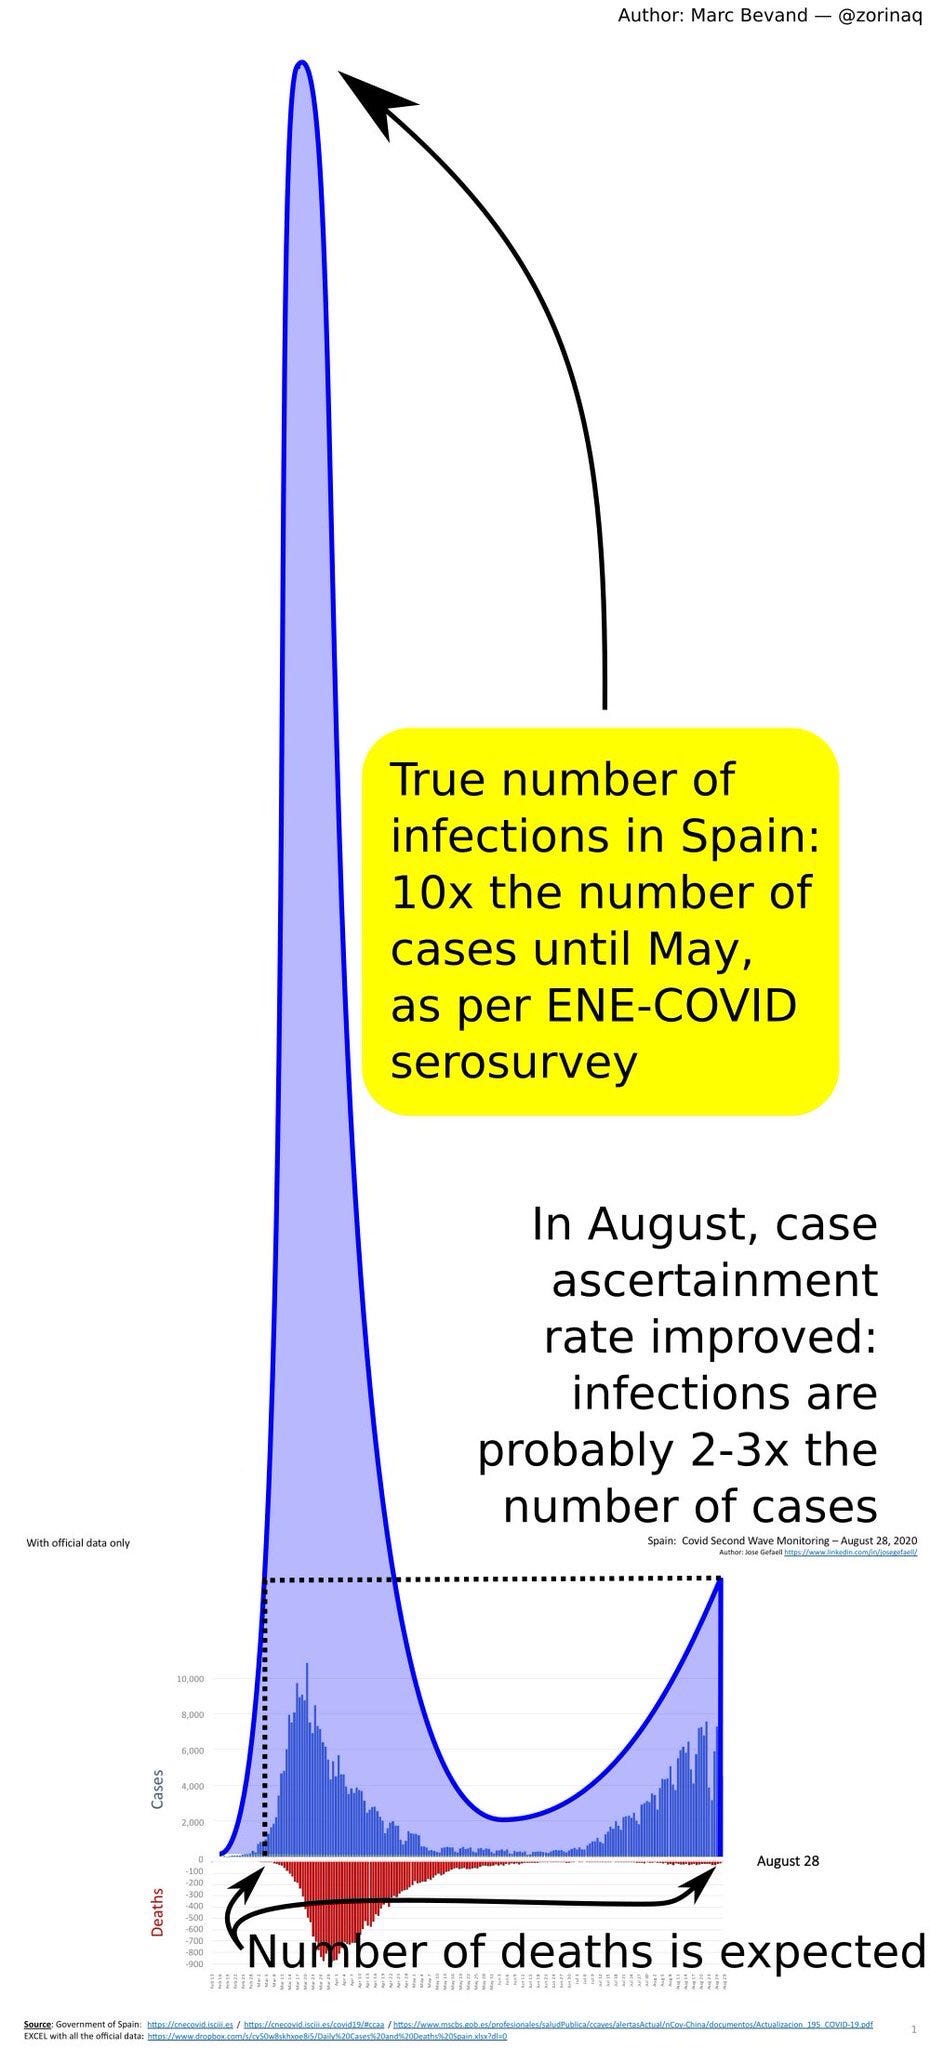
The other way to show that a nation has a very low case ascertainment rate is to check the results of serosurveys. By selecting a random subset of a country and testing everyone's blood for antibodies, one can determine the viral prevalence over the past few months, compared to the number of positive tests during the same period. For example, Spain did not have enough tests early in the pandemic either; the ENE serosurvey would later show only 1 in 10 cases was positively identified. This leads to two confusions:
News agencies and laypeople looking at the data (dark blue only) often drew the conclusion that the second wave had more infections and we should "brace ourselves" for the pile of dead bodies. Except that pile fails to materialize in the second wave, which surprised many people. Some invoked the "dry tinder" argument to explain that the first wave was particularly lethal because all fragile people quickly expired as the virus circulated.
Secondly, many news agencies never retrospectively update their case counts after serosurvey data is available. Progress defeating the pandemic looks slower than it actually is because 100,000 new cases in 2021 has a bigger % change impact on the total when the original total is undercounted
4. Model projections
Those who have followed my work for the last several years will already be familiar with my general disdain for models. For any model to be trusted, it must be compared to empirical measurements and must demonstrate skill. The CDC would gather model projections from universities and epidemiologically-inclined groups and average them together to produce 4-week look-ahead projections. I gathered these forecasts and retrospectively compared them to actual case counts. I note that the model ensemble is no better than a quadratic extrapolation of the previous 4 weeks of cases. Also, no single modeling group was a "stand out" to look at and trust for next time.
5. End days: Vaccine development
The mRNA "vaccine" was released in December 2020, just 13 months after the virus first appeared.
Kaplan-Meier Curve
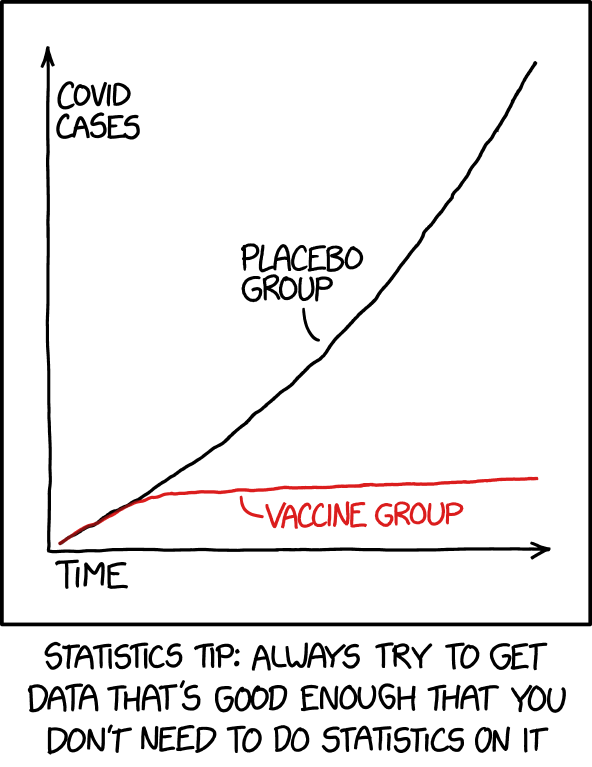
Pfizer put the test results for their vaccine online. 21,669 people received the vaccine and 21,686 received a placebo and their infection rates were tracked for 112 days. The cumulative incidence curve, or Kaplan-Meier curve, shows the results experienced by the former in blue and the latter in red:
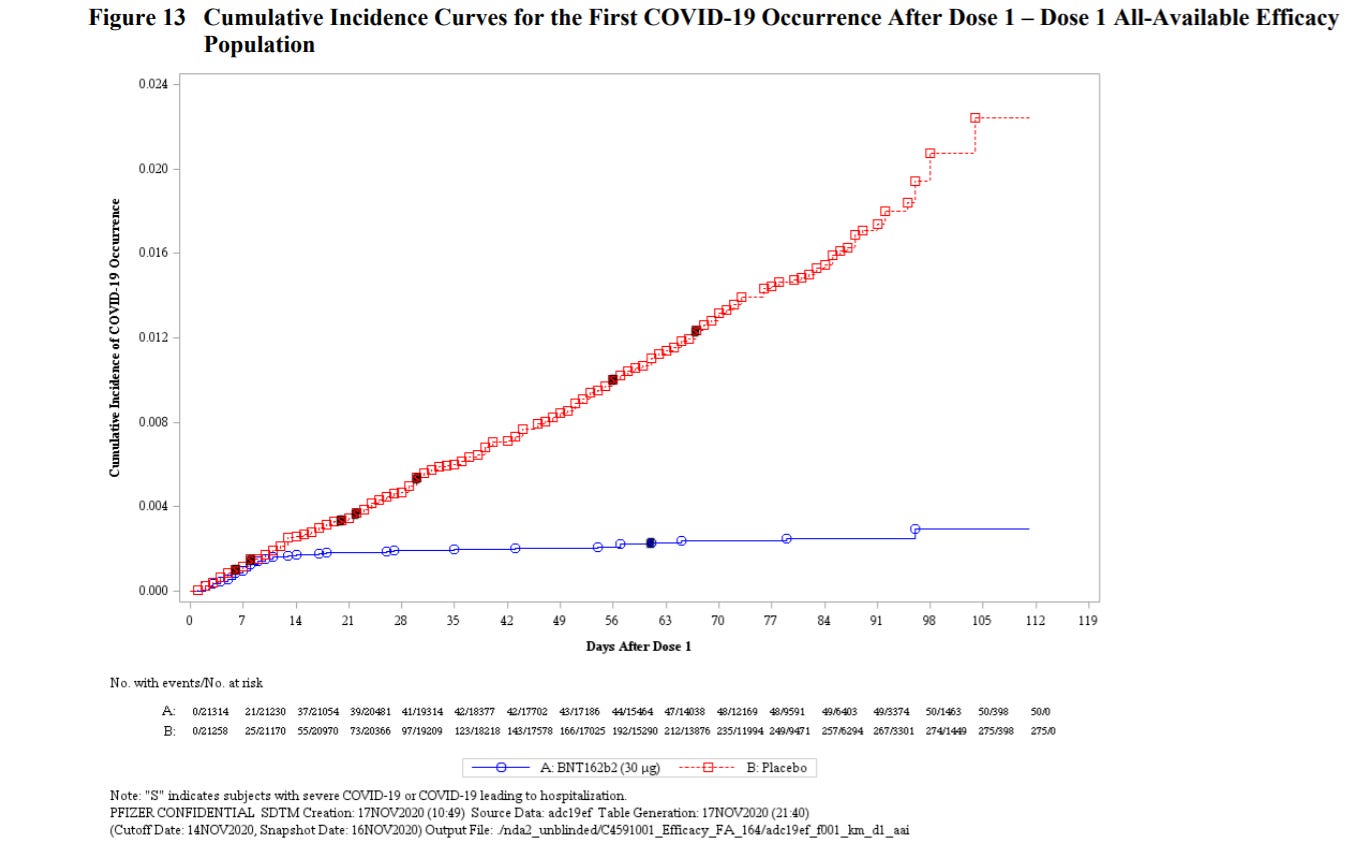
This is a beautiful way of showing that, about a week after administering the mRNA injections, the test group (blue) essentially stops contracting new cases of COVID, while the control group (red) continues to contract the virus at about the same rate. I like the Pfizer chart, but the xkcd comic conveys this even more simply:
Waning protection
I put quotes around "vaccine" because it did not perform the way most expect a vaccine to perform. Recall that:
One Tetanus vaccine injection protects against infection for 10+ years
Four Polio vaccine injections protects against infection for life
But the COVID mRNA vaccine protection waned after about one year. After the first two injections, a third injection "booster" was recommended to restore protection, but that too waned after several months. Thus, the COVID vaccine behaves more like a flu shot:
Must be dosed annually
Protection is variant-specific; if the wrong variant spreads, the flu shot offers limited protection.
Protection fades, must be administered yearly
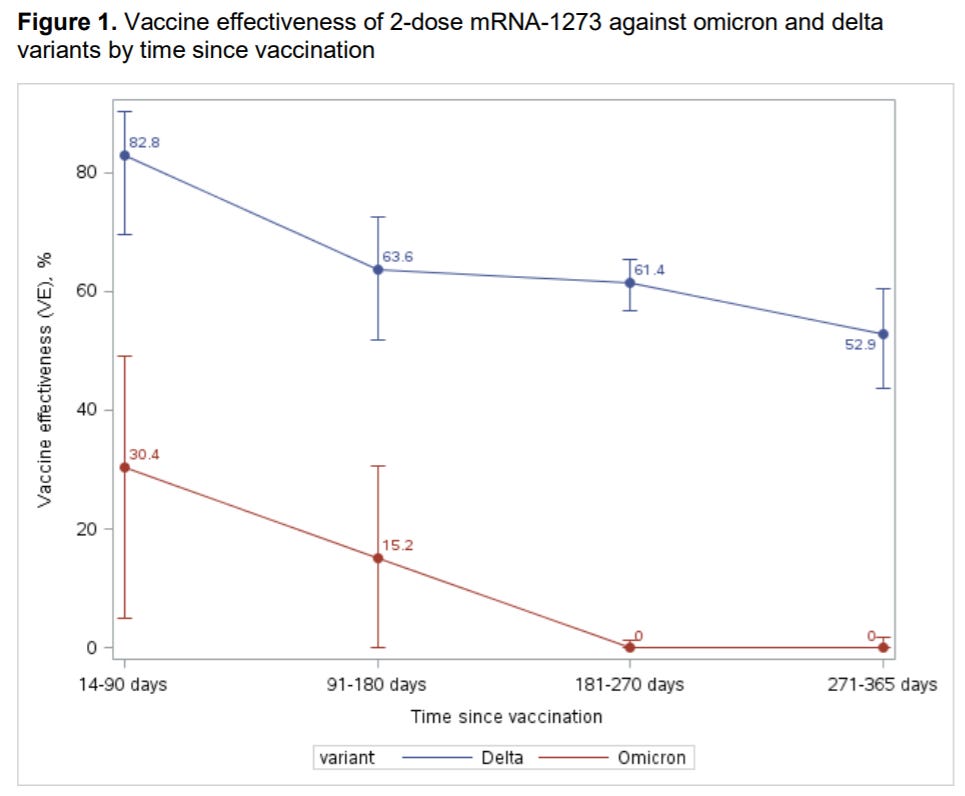
Since the COVID-19 mRNA vaccine actually behaves like a flu shot, the fact that vaccinated people began contracting the virus after 9+ months led to vaccine hesitancy (see footnote 1 for discussion on the evolving definition of “vaccine”).
Vaccine hesitancy
Among the people I personally know, only about 2/3 elected to get the vaccine. The rest were hesitant and wanted to “wait and see” if there were any long term side-effects. To them, it seemed silly to be the first to get vaccinated, but in their defense there are a couple examples of novel medications causing damage and being withdrawn from the market (see: thalidomide or the Tuskegee study). Brand new safety devices like airbags, life jackets, vaccines, etc may save your life or harm you, and the wait-and-see approach is useful for a time. Perhaps someone thinks: "it takes 2 years (or some number) for the side-effects to show up" and so they think they should wait a long time before getting vaccinated. This is operating under the fallacious notion that everyone who got the vaccine will simultaneously show the side effect at precisely the 2 year mark. But that's not how it works. When a billion people get the vaccine, side effects emerge much sooner according to a gamma distribution function
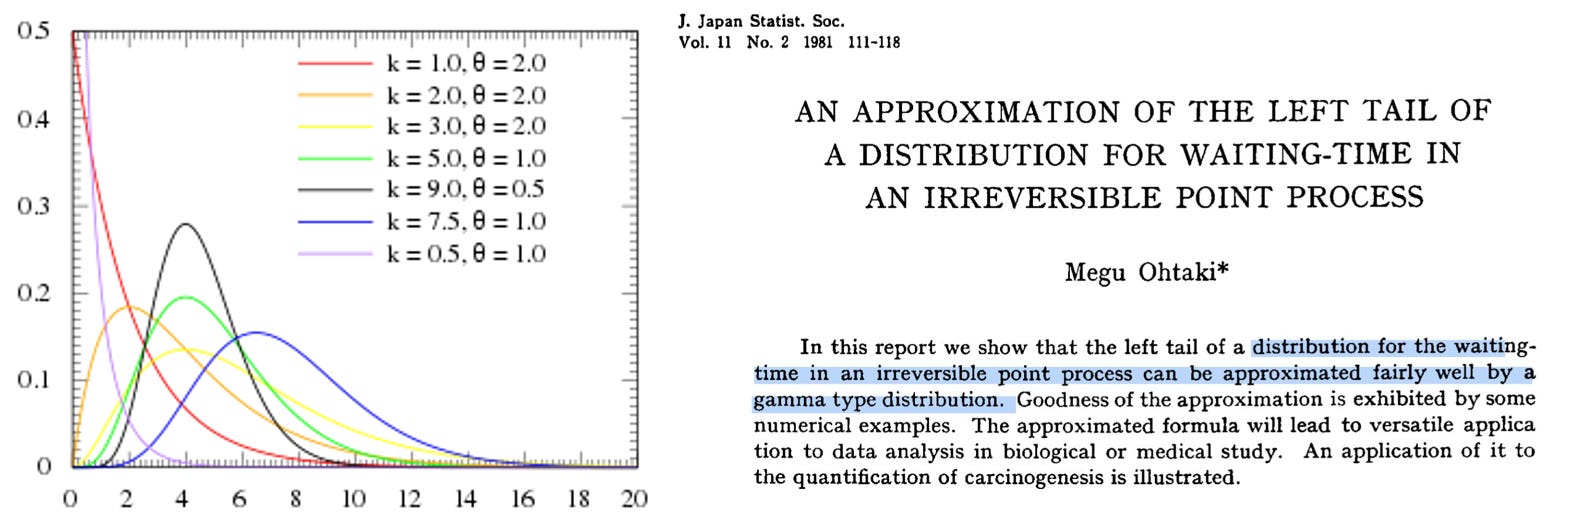
The tail of the distribution on the near-term side of the gamma distribution peak does not need to be very large to show a meaningful number of instances of the side effect occurring when a large number of doses are administered. We can expect:
All side effects are known months after hundreds of thousands of vaccines are administered
All side effects are known weeks after hundred of millions of vaccines are administered
This requires one to consider the likelihood that they will catch the disease and become severely ill or die after the vaccine is available but before they decide to get vaccinated. I cannot see this time frame justifiably being longer than ~6 months after there have been 10 million doses. If you're still holding out at that point, it's not because of the side effects argument.
6. Epilogue: Masking
Masks are primarily a substitute for covering your cough. They reduce outbound droplets, not inbound (absent a well-fitted N95) despite widespread confusion on this. Why masking became such a battle, I will never fully understand.

This letter written to a newspaper cleverly analogizes the importance of masking, which is primarily for the benefit of others:
Footnotes:
1The term “vaccine,” like many words in the English language, has had an evolving definition. A parent paying a visit to the doctor’s office is likely to encounter this poster, which asserts the vaccine will prevent the disease:
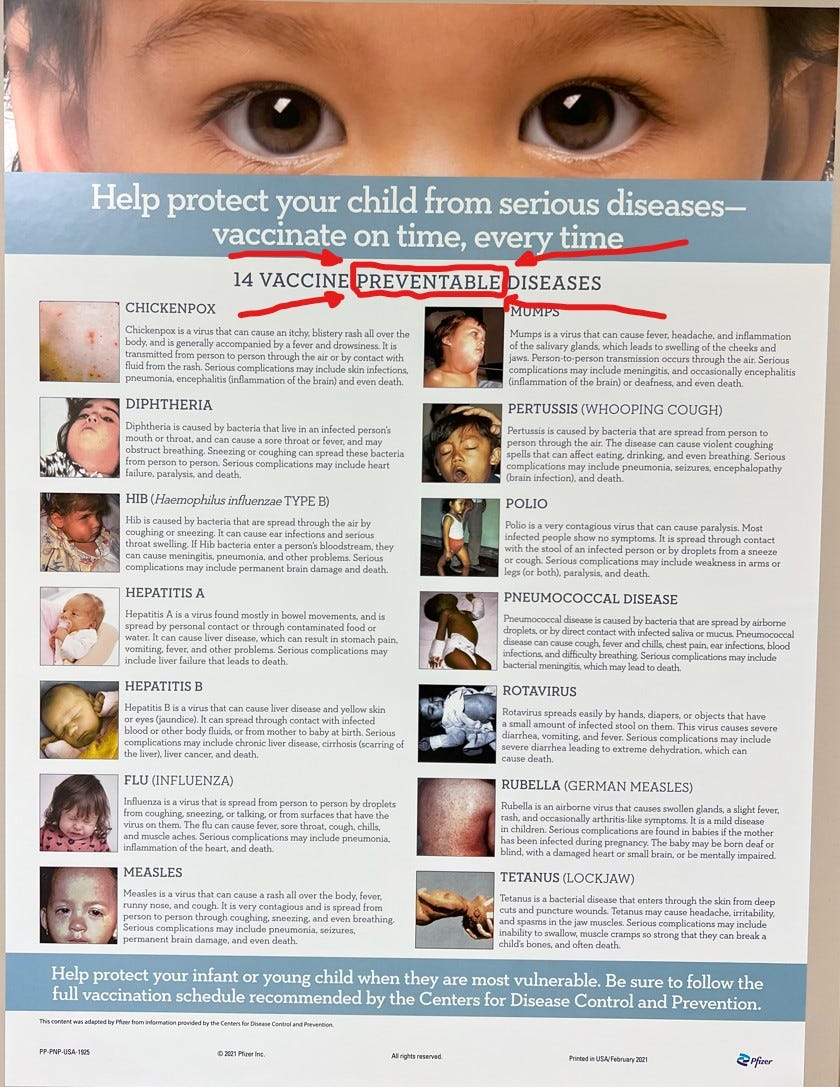
Indeed, this definition also appeared on the cdc.gov website from 2007 to 2014, specifically using the phrase “prevent a disease.” 2007 is the earliest snapshot on the WaybackMachine, but the CDC certainly used the phrase “vaccine-preventable” going back much longer (example from 1996).
Sometime between July 9, 2014 and October 10, 2014 the definition was updated to remove the words “prevent a disease” opting instead for “produce immunity to a specific disease.”
Today, the cdc.gov website no longer features the phrase “prevent a disease” or “produce immunity” and instead now defines a vaccine as that which “produces protection”
It is not unreasonable to expect the typical person-on-the-street in 2021 to be carrying the understanding that “a vaccine prevents a disease.” This internal definition would conflict with mRNA vaccine performance, which performed well against the alpha variant, but did not prevent all delta/omicron infections. Yet vaccine still afforded some benefit in the form of less-severe delta/omicron infections, so the updated definition of “vaccine” still applied in 2021 even if the pre-2015 definition no longer applied. But populations don’t update their internal definitions quickly and universally.